Blog Posts

Financial Independence: Getting Started
Financial independence is the state of having enough income to cover all of your expenses without relying on earned income from a job or other sources.

Financial Independence: Basic Budgeting
Budgeting is the process of methodically determining your reoccurring income and expenses. The budgeting process includes setting limits on how much you spend and goals on how much you earn.

Financial Independence: Risks
Investing inherently involves risk, and this fundamental principle remains unchanged. The level of risk varies depending on your investment choices and the strategies you employ to mitigate it.

The Power of Dividend Reinvestment
Overview of dividend reinvestment including pros, cons and a practical example.

Dive Deep into Social Security: Unraveling the Complexities
Unlock the mysteries of U.S. Social Security – history, benefits, calculations, and more.

Financial Independence: Investing
Investing in assets that generate cash flow is a key component of achieving financial independence.

Demystifying Dividend Yield: Your Roadmap to Informed Investing
Unlock the power of dividend yield in your investment strategy. Learn how to calculate it and make informed investment decisions. Plus, discover the role of dividend income in retirement planning.

Understanding the Dividend Payout Ratio: A Key Metric for Dividend Income Investors
We will explore the dividend payout ratio, how to calculate it, and delve into its significance for income generating stocks.

Shutdown of Income Reign
Blog post about what lead to the shutdown of the Income Reign software.

Aligning with other Kingdoms: Featuring Projection Lab
Discover how Projection Labs aligns with the Income Reign philosophy for strategic wealth building and long-term financial planning. Explore its features, from robust forecasting to Monte Carlo analysis.
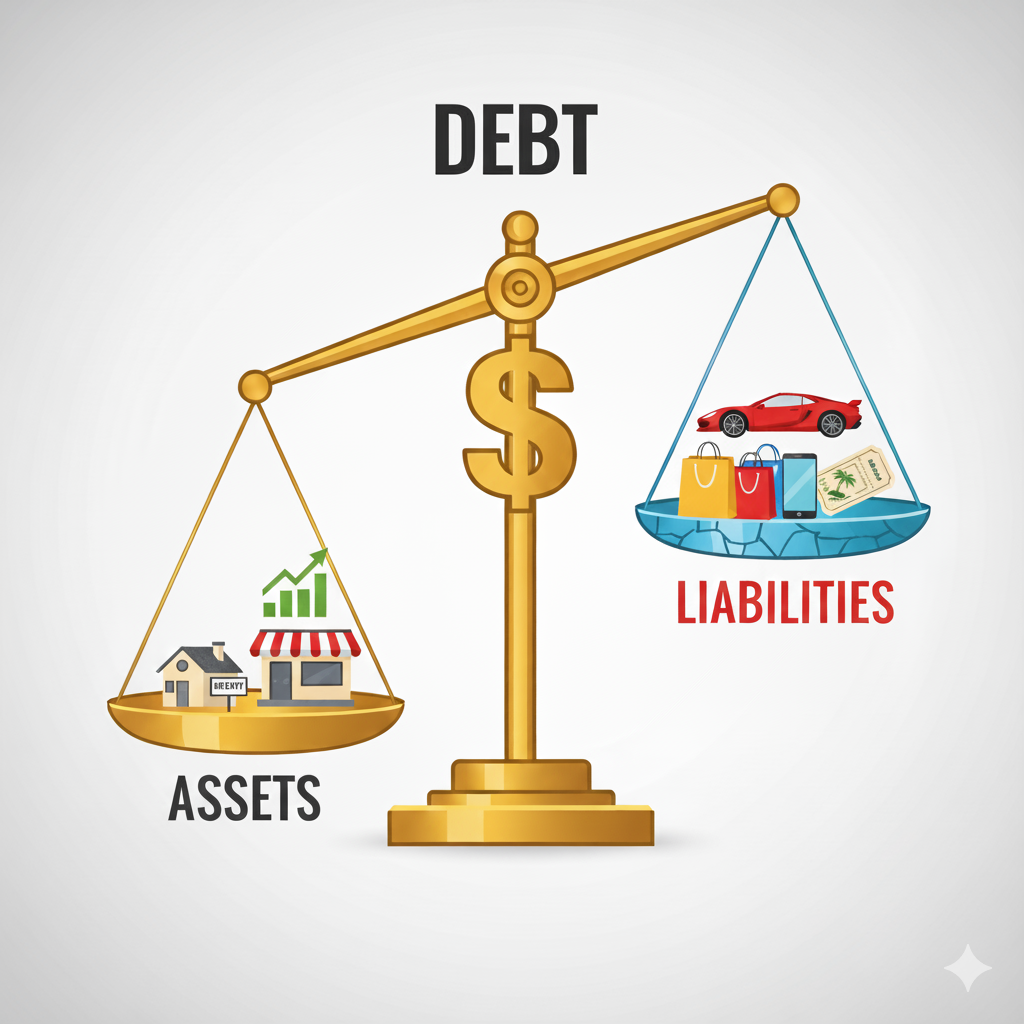
The Debt Tool: How to Use Borrowed Money for Assets, Not Liabilities
Learn how to use debt as a powerful tool for building wealth. This post explores the difference between good and bad debt, and how to use borrowed money to acquire assets, not liabilities.
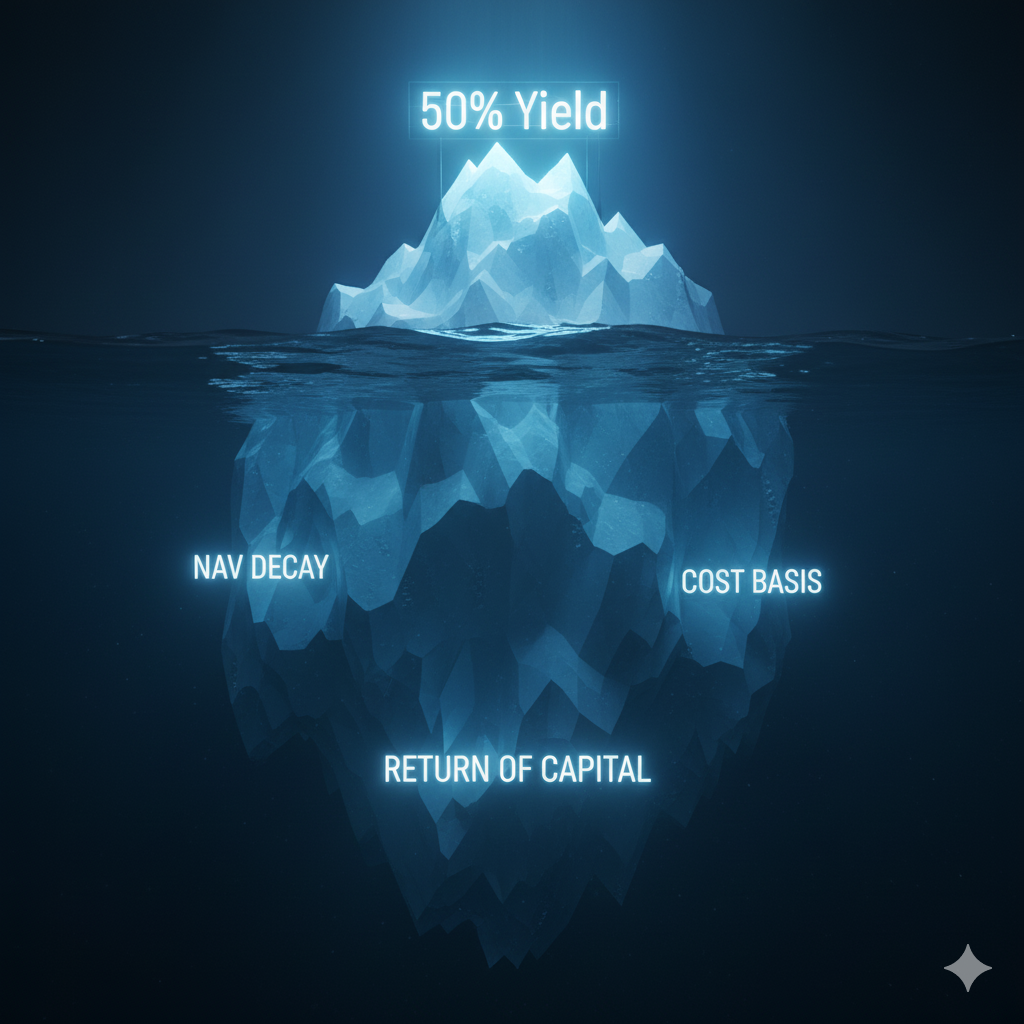
Beyond the Hype: How to Truly Analyze YieldMax, Defiance, and Other High-Yield ETFs
Learn how to properly analyze high-yield ETFs like YieldMax and Defiance by calculating Yield on Cost (YOC) and Return on Capital (ROC).

The Yield Evolution: A 2026 Strategic Outlook for YieldMax & Defiance & Roundhill
A data-driven 2026 outlook for YieldMax & Defiance & Roundhill. Discover how the 'Fed Floor', volatility paradox, and tax rules reshape the high-yield strategy for the years ahead.

The 2025 Tax Guide for Income Investors: Surviving the 'OBBBA' Brackets
A survival guide to the 2025 tax landscape for income investors under the new OBBBA. Covers standard deductions, qualified vs ordinary dividends, and the capital loss trap.
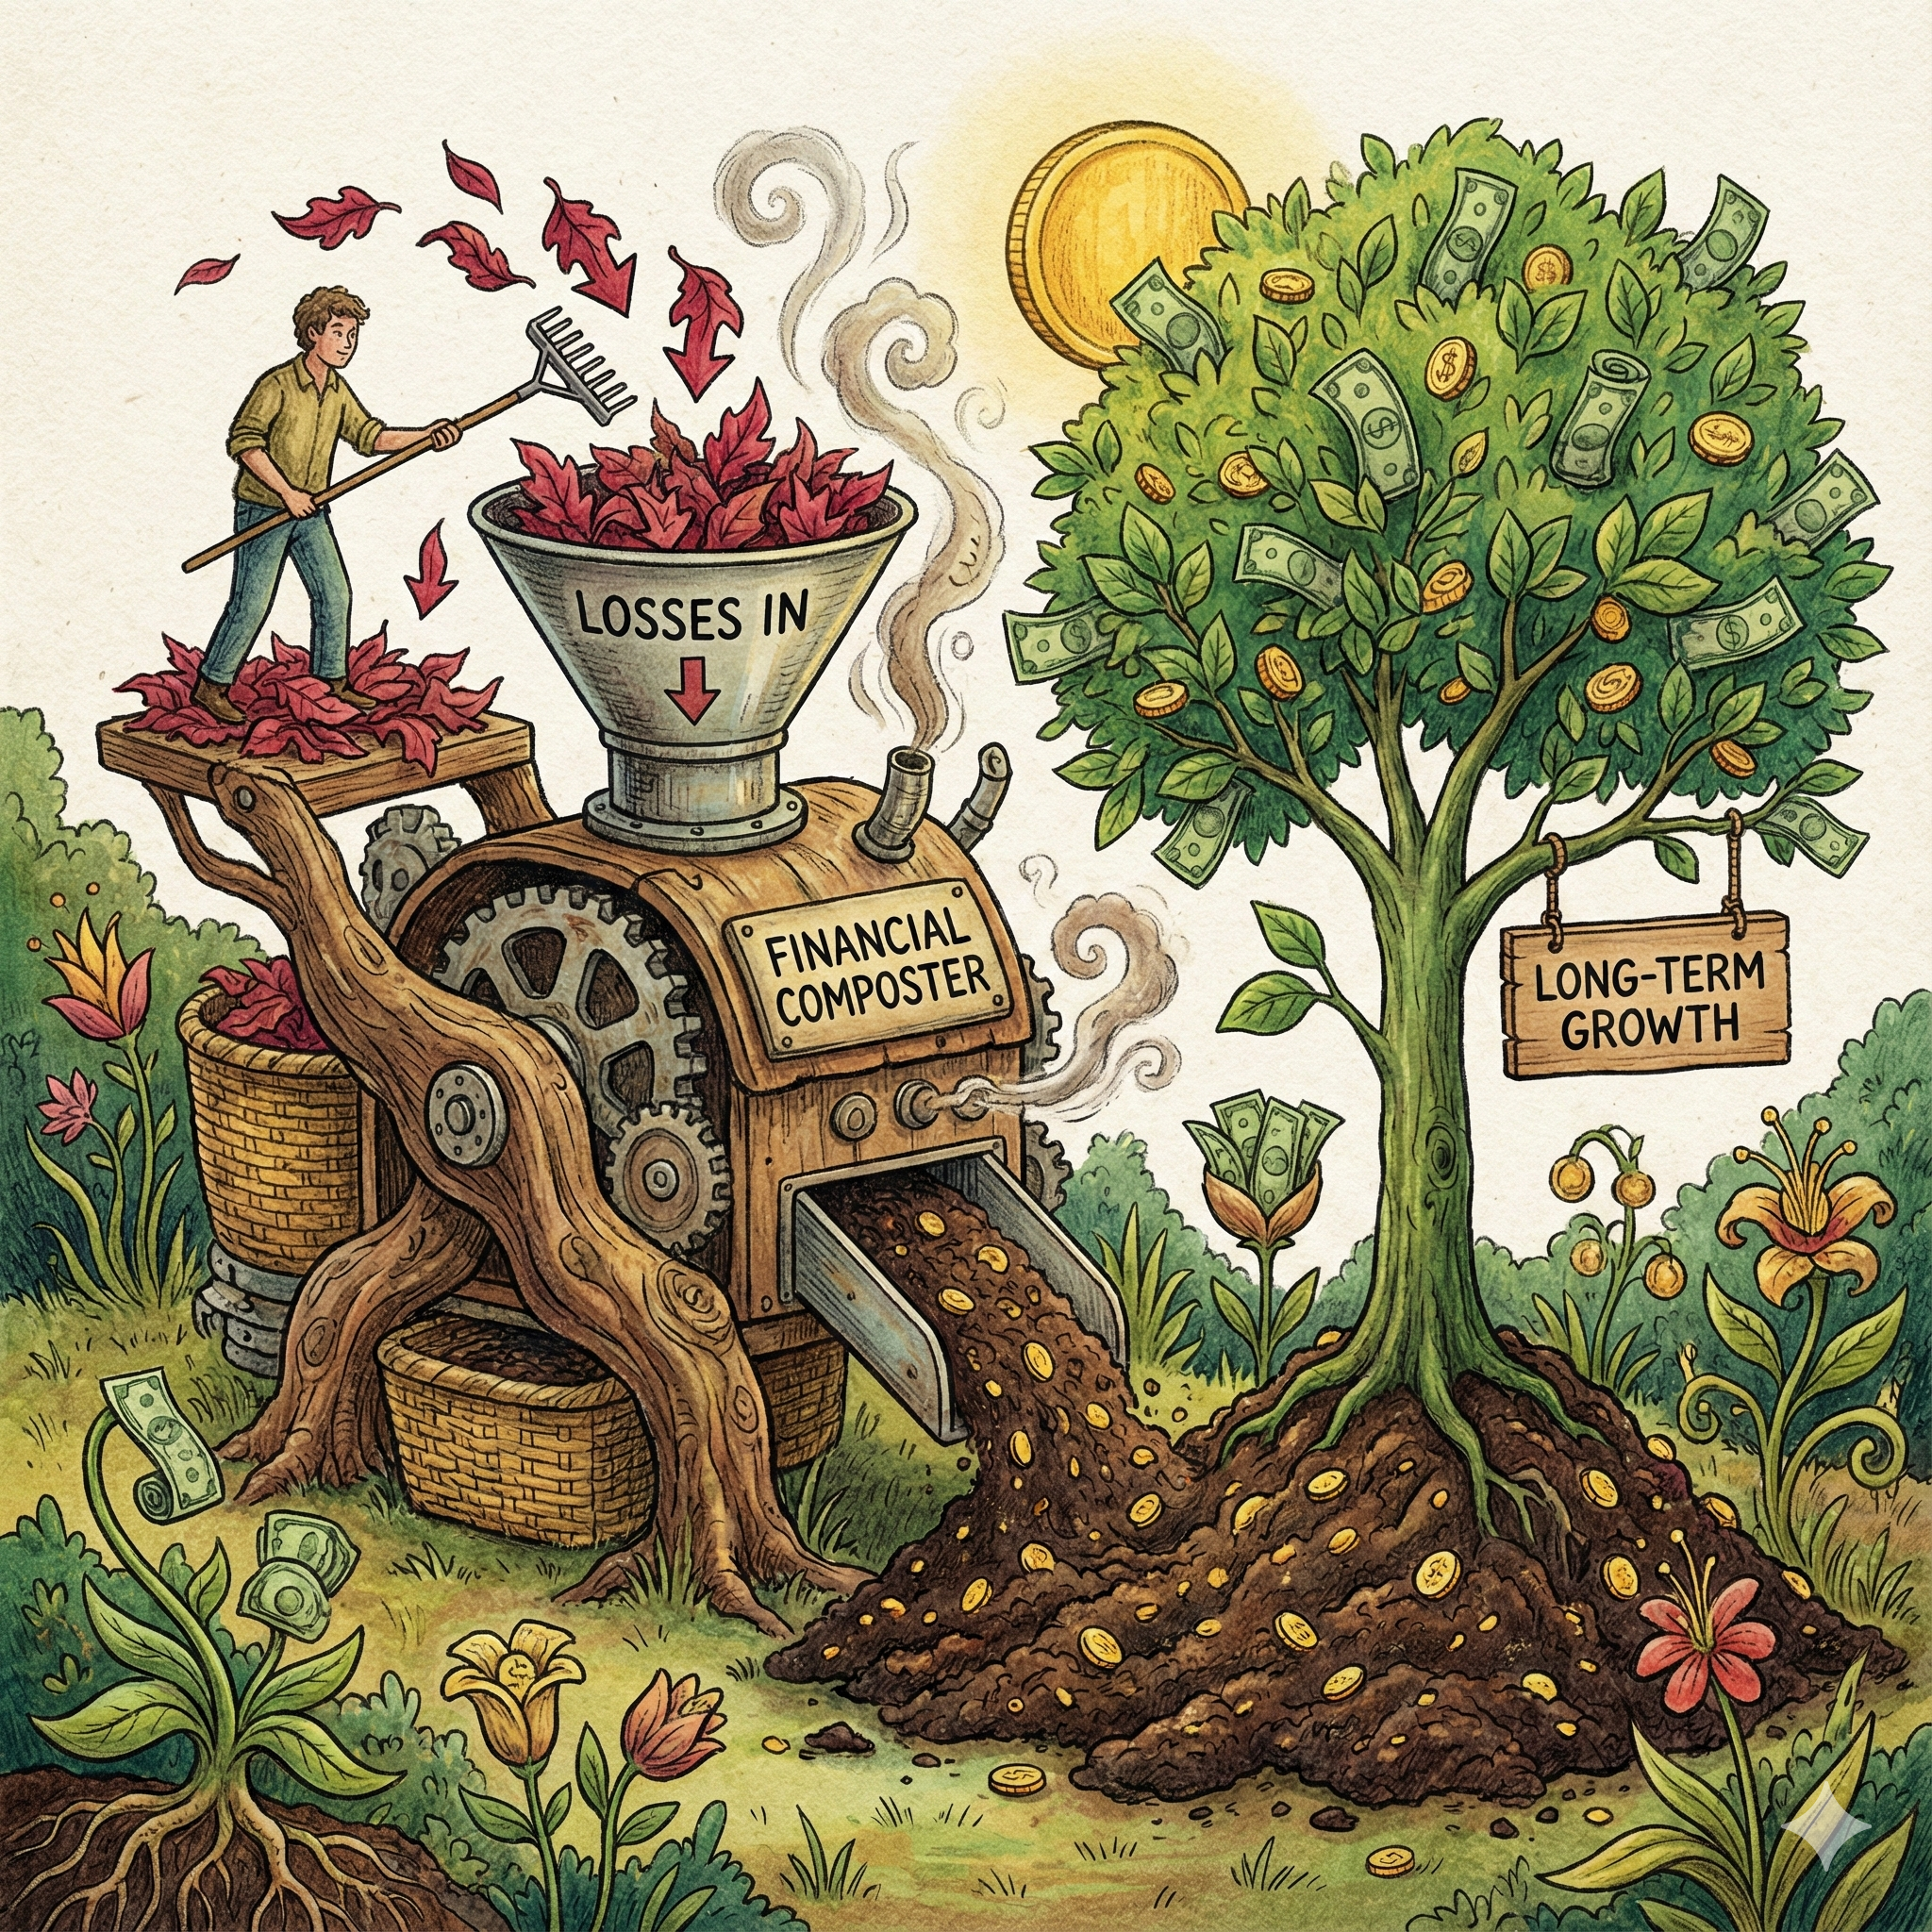
Harvesting Losses in High-Yield ETFs: The 'Safe Swap' Master List
A comprehensive 'Safe Swap' master list for harvesting losses in high-yield ETFs like YieldMax and Defiance while avoiding wash sales.

Structural Analysis of Margin-Enhanced Income Strategies
The contemporary financial landscape includes high-yield instruments such as Option Income ETFs, CEFs, and BDCs. This report analyzes the arbitrage spread between borrowing costs and distribution yields.

Monarch Money Review (2026 Edition)
The Verdict: Monarch Money is the gold standard for high-level financial oversight, making it an essential tool for the FIRE community.