Beyond the Hype: How to Truly Analyze YieldMax, Defiance, and Other High-Yield ETFs
High-yield covered call ETFs from issuers like YieldMax, Defiance ETFs, GraniteShares, and Roundhill have taken the income investing world by storm. Their staggering double-digit yields are tempting, but savvy investors know that the advertised yield doesn't tell the whole story.
We used to have a dedicated tracker in the past but as we no longer have license to the data, the next best approach is to teach you how to calculate the numbers yourself.
The secret to properly evaluating these complex funds lies in looking past the surface-level numbers. Instead of just chasing the highest distribution rate, you need to understand your personal Yield on Cost (YOC) and the fund's actual Return on Capital (ROC). This guide will teach you how to calculate these essential metrics, empowering you to make smarter investment decisions.
Why These Payouts Aren't Just "Dividends"
First, it's crucial to understand that the monthly payouts from these funds are technically "distributions," not "dividends." A dividend is a share of a company's profits. The distributions from these ETFs, however, are a mix of different sources:
- Income from Options Premiums: The core of the strategy, generated by selling covered calls.
- Dividends: Pass-through dividends from the underlying stock (e.g., TSLY holds Telsa stock).
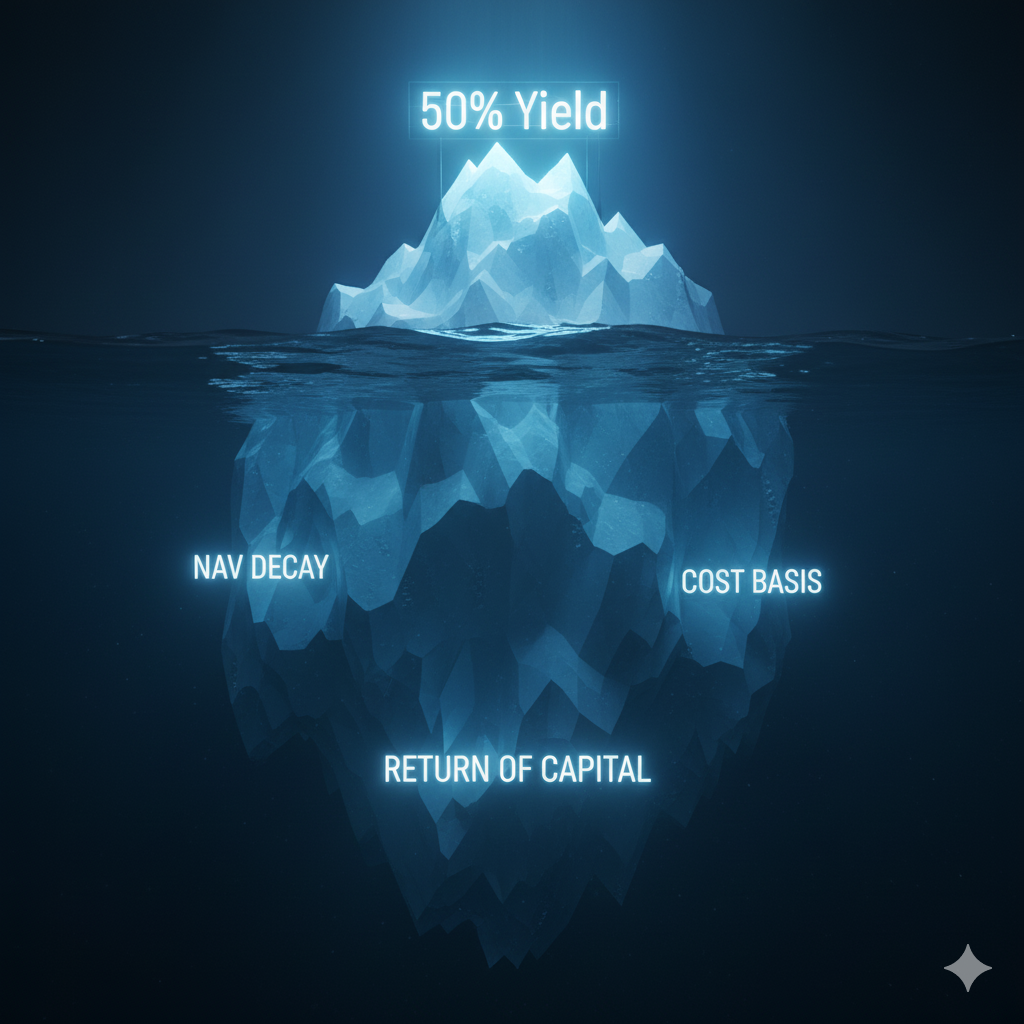
- Return of Capital (ROC): This is the most misunderstood part. Sometimes, the fund will literally return a portion of your original investment money back to you. This is not a profit. It reduces your cost basis but can artificially inflate the perceived yield if you don't track it properly.
Because of these complexities, you need better tools to measure your true performance.
Key Formulas: Yield on Cost & Return on Capital
To get a clear picture of your investment's performance, we'll use two powerful formulas. Note: Average cost per share or initial share price is subjective. You can use your brokerage's cost basis OR you can keep track of your own if you dollar cost average or DRIP.
📈 Yield on Cost (YOC)
Yield on Cost measures the annual distribution rate relative to the price you originally paid for the investment. It's a personalized metric that shows the performance of your initial capital. As the fund's distributions increase over time, your YOC on that fixed initial investment grows.
The Formula:
- Total Annual Distributions per Share: The sum of all distributions paid out by the fund over a 12-month period.
- Your Average Cost per Share: The weighted average price you paid for all your shares in that ETF.
💰 Return on Capital (ROC)
Return on Capital (not to be confused with Return of Capital) is a broader metric that measures the fund's efficiency at generating profits relative to the capital it has. For our purposes, we can simplify it to measure the total return (distributions + price change) against the initial price over a specific period.
The Formula:
- Initial Share Price: The price of the ETF at the beginning of the period you are measuring.
- Current Share Price: The price of the ETF at the end of the period.
- Total Distributions Received: The sum of all distributions paid out during that period.
This formula shows you the total return, accounting for both the income you've received and any appreciation or depreciation in the ETF's share price.
How to Calculate These Metrics: A Step-by-Step Guide
Let's walk through how to find the data and apply these formulas.
Step 1: Find Your Average Cost per Share
Log in to your brokerage account. For any given position (like TSLY or QQQY), it will show you the average cost or cost basis per share. This is the denominator for your YOC calculation.
Step 2: Find the Distribution History
Go directly to the issuer's website (e.g., the YieldMax funds website). They will have an "investor relations" or "distributions" section with press releases detailing every distribution paid, including the amount per share and the date.
Step 3: Calculate Your YOC
Sum up the distributions per share over the last 12 months. Divide that total by your average cost per share from Step 1.
Example:
- You bought 100 shares of TSLY at an average cost of $15.00/share.
- Over the last 12 months, TSLY paid out a total of $8.50 in distributions per share.
- Your YOC = $8.50 / $15.00 = 0.5667 or 56.67%.
Step 4: Calculate the Fund's ROC for a Period
Choose a period to analyze, for example, the last calendar year.
- Find the share price at the start of the period (e.g., January 1st).
- Find the share price at the end of the period (e.g., December 31st).
- Sum up all the distributions paid during that year.
- Plug these numbers into the ROC formula.
Example (using hypothetical numbers for a fund):
- Initial Price (Jan 1): $20.00
- Current Price (Dec 31): $18.50
- Total Distributions in Year: $4.00
- ROC = ($18.50 - $20.00) + $4.00 / $20.00 = (-$1.50 + $4.00) / $20.00 = $2.50 / $20.00 = 12.5%.
Even though the share price dropped, the hefty distributions resulted in a positive total return on capital for the year.
Sample Analysis Table (Data as of Q3 2025)
Here is a sample table using the ROC calculation and YOC Calculations for popular funds for 2024, and 2025 assuming that you only bought shares when the fund first came out.. Remember that you should use your weighted average price instead of the initial share price for your calculations. PLYY is actually very new so keep in mind how long these funds have been running. Your numbers will be different based on when and at what price you purchased the shares.
These funds are popular but note that each fund provider has high performers and low performers. Please evaluate each etf on your own.
By using Yield on Cost and Return on Capital, you move beyond being a passive yield-chaser and become an informed analyst of your own portfolio. These simple calculations provide the clarity needed to successfully navigate the exciting but complex world of high-yield ETFs.
Disclaimer
The content provided in this article, including any calculations, formulas, and analysis of securities like YieldMax, Defiance ETFs, GraniteShares, and Roundhill products, is for educational and informational purposes only. The author is not a licensed financial advisor, and nothing in this post should be construed as financial, investment, legal, or tax advice.
Accuracy of Information: While all efforts are made to present accurate information, the data and calculations are based on publicly available information that may be subject to change or error. We make no guarantee as to the completeness or accuracy of the information provided. Financial markets are dynamic, and information can become outdated quickly.
No Recommendations: The mention of specific securities or ETFs is not a recommendation to buy, sell, or hold any investment. It is for illustrative purposes only.
Investment Risk: All investing involves substantial risk. The high-yield strategies discussed in this post carry unique risks, and past performance is not indicative of future results. You are solely responsible for your own investment decisions, which should be made in consultation with a qualified professional. The author and this website will not be held liable for any investment losses you may incur.